Most of the examples over the net shows how to collect metrics using Prometheus and Grafana. That is one of possible solutions of course, however it also requires having Prometheus or Grafana installed somewhere is your project. What if I don't want to install and maintain them in a future? What if corporate policy making this hard to introduce new product in the stack?
Today I will show how to start collecting metrics and explore them in minutes.
First let's clarify why we need collect metrics for your application:
- Performance Monitoring: Metrics help you monitor the performance of your API application. By collecting metrics such as response times, throughput, error rates, and resource utilization, you can identify bottlenecks, detect performance degradation, and optimize your application for better efficiency.
- Capacity Planning: Metrics provide data on resource consumption, such as CPU, memory, and disk usage. This information helps you understand the resource requirements of your API application and plan for scalability. By analyzing historical trends, you can predict future resource needs and scale your infrastructure accordingly.
- Troubleshooting and Debugging: When issues arise, metrics can be invaluable for troubleshooting and debugging. By examining metrics related to error rates, latency, and request patterns, you can quickly identify problematic areas and focus your efforts on resolving the root cause of the problem.
- Service-Level Agreement (SLA) Compliance: If your API application has an SLA or performance targets, collecting metrics allows you to measure and monitor the compliance with these agreements. You can track metrics such as response times and availability to ensure that your application meets the defined SLA requirements.
- User Experience Optimization: Metrics can help you understand how users are interacting with your API application. By collecting data on usage patterns, endpoints accessed, and user behavior, you can gain insights into user preferences and optimize the API to enhance the overall user experience.
- Security and Anomaly Detection: Metrics can assist in identifying security threats and anomalies in your API application. By monitoring metrics related to authentication failures, request patterns, and traffic spikes, you can detect potential security breaches or abnormal activities and take appropriate actions to mitigate risks.
- Business Insights: Metrics provide valuable data for business decision-making. By analyzing metrics such as user adoption, usage patterns, and transaction volumes, you can gain insights into the success of your API application, identify areas for improvement, and make informed business decisions.
- Continuous Improvement: Collecting metrics allows you to measure the impact of changes or optimizations made to your API application. By comparing metrics before and after modifications, you can assess the effectiveness of your changes, iterate on improvements, and drive continuous improvement in your application.
Konso allows you collecting metrics for your .NET API and ASP.NET application for monitoring, analyzing, optimizing, and improving various aspects of your application, leading to better performance, enhanced user experience, and informed decision-making.
Konso Account
Create a Konso account by filling simple registration form
Create a new bucket
A bucket in Konso is like a container that holds a set of specific functions or features. It is a fundamental part of the Konso data structure and serves as a way to organize and group together related functionalities. Think of it as a collection of chosen tools or capabilities that are grouped together for a specific purpose.
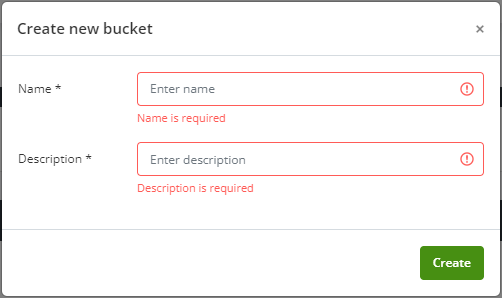
Name - Name of a bucket e.g. "ToDo DEV", "ToDo PROD", I organize data by environment.
Description - Write a description for a bucket.
Install the library via NuGet or by manually referencing the assembly in your project
NuGet\Install-Package Konso.Clients.Metrics
Initialize the library with your API credentials and configuration settings
Add config to appsettings.json:
"Konso": {
    "Metrics": {
    "Endpoint": "https://apis.konso.io",
    "BucketId": "<your bucket>",
    "ApiKey": "<bucket's access key>"
    }
}
in startup.cs:
builder.Logging.ConfigureKonsoMetrics(options =>
{
    options.Endpoint = builder.Configuration["Konso:Metrics:Endpoint"];
    options.BucketId = builder.Configuration["Konso:Metrics:BucketId"];
    options.AppName = builder.Configuration["Konso:Metrics:App"];
});
then, you will need to register a middleware:
builder.UseKonsoMetrics();
That's it! You will need just start your project.
Here are some ideas on how you can utilize the metrics overview screen in collecting your project's metrics with Konso:
Monitoring the number of requests compared to the previous period can provide insights into any potential issues or abnormalities in your application.
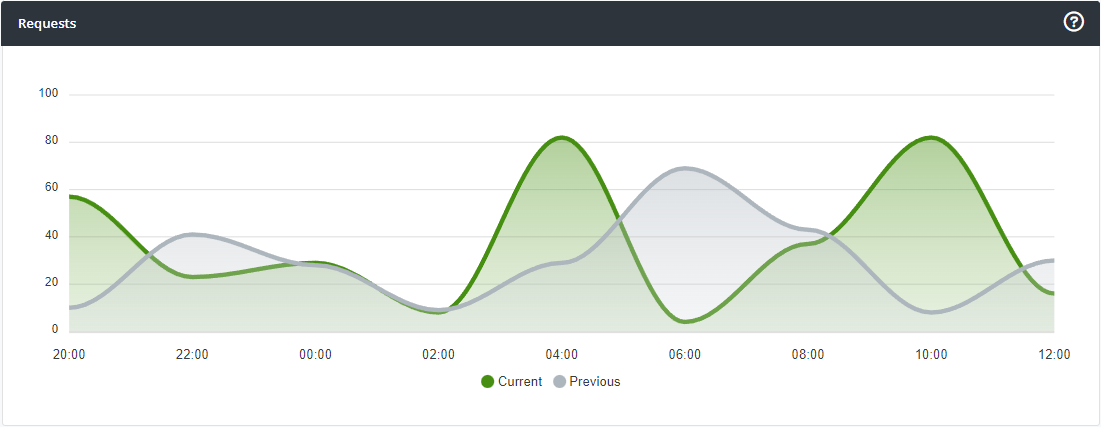
Tracking response times compared to the previous period enables early detection of anomalies or potential issues.
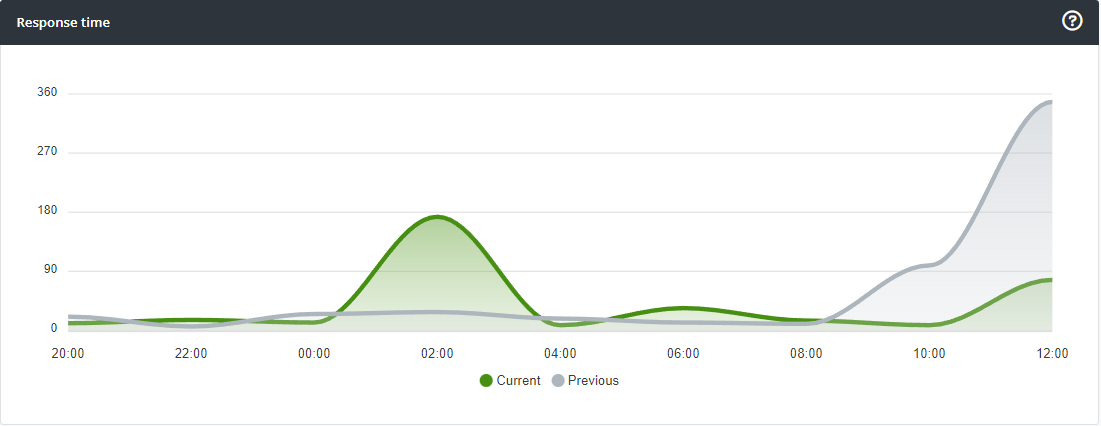
Analyzing responses by HTTP code can aid in understanding the types of requests being sent to your application.
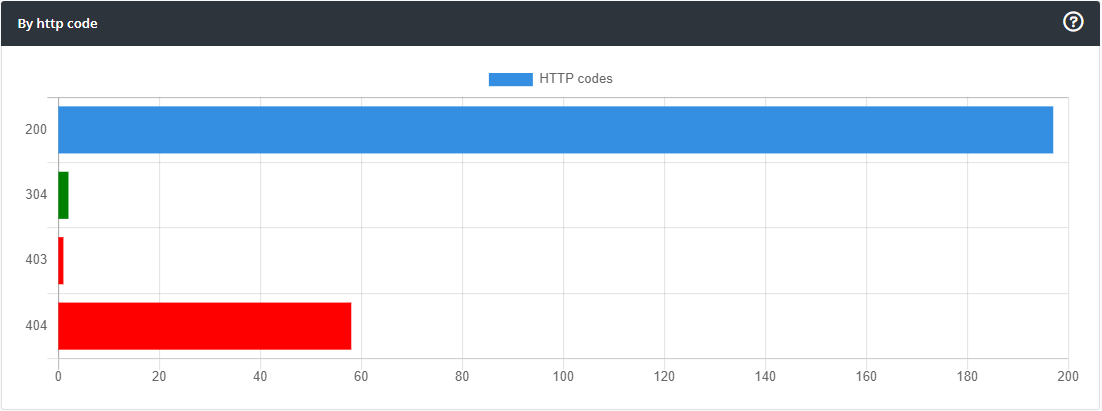
By utilizing Konso's metrics overview screen, you can gain valuable insights into your .NET API's performance, detect anomalies or issues early on, and understand the types of requests being sent to your application, enabling you to make data-driven decisions and optimize your API for enhanced functionality and user experience. Start harnessing the power of data today with Konso and take your .NET API monitoring to the next level.

No comments are allowed for this post